
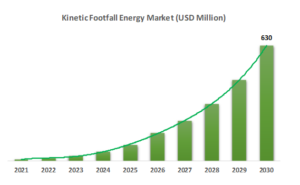
The Global Kinetic Footfall Energy Harvest Market is projected to grow at a CAGR of 54.1% over the decade. The key drivers of the Kinetic Footfall Energy Harvest are; rapid urbanization across the world, increasing adoption of piezoelectric energy harvesting technology, and increasing focus on balancing modernization with nature by reducing the carbon footprint.
With the growing need for renewable energy, smart cities are looking for more sustainable and cost-effective choices. Piezoelectric technology in the form of kinetic tiles, smart speed absorbers, and reactive flooring could power everyday life in the near future: roads, paths, public transportation, and more. By strategically deploying kinetic tiles in crucial locations of a city, one may have on-demand lighting, mobile phone charging stations at bus stops, and interactive displays that are powered solely by foot traffic, saving energy.
The Internet of Things (IoT) is increasingly being adopted across various end-user industries. Crowded places with high footfalls such as airports and public stations, business buildings, and department stores, are employing smart IoT-devices, such as Radio-frequency identification (RFID) sensors and (GPS). When looking for an alternative source of energy for such gadgets, kinetic footfall energy holds high potential and its wide adoption in countries with high population density such as China and India is expected over the years to come.
Segment overview
On the basis of mechanism, Piezoelectric mechanism held the largest share of global kinetic footfall energy harvest market in 2020. Even with a steady or predictable vibrational frequency, piezoelectric can generate energy. It is perfect for a variety of applications due to its capacity to leverage any type of force, stress, or strain, and so has a growing market potential. Piezoelectric floors in public spaces can scavenge a decent amount of energy that can be used to power electrical equipment such as lighting and screens. However, piezoelectric application still needs to overcome many challenges including varying or inconsistent vibrational frequency range.
On the basis of End-Use, Ticket gates at train and tube stations are an obvious application, however the technology is also suitable to work at shopping malls, sports arenas, and even airport terminals. It's also a very elegant method to match supply and demand, as it creates more energy when more people move across the energy-producing materials. Energy Floors, a Dutch company installed the flooring for Club Watt in Rotterdam, making it the world's first sustainable dance floor and saving the club 30% on electricity expenditures. The company also created interactive smart flooring systems for crowd control and navigation in smart cities, as well as gamified physical training and dance. The startup's solutions, which are mediated by footfall sensors, not only supply specific electricity needs in schools and communities, but also capture large data for subsequent analysis.
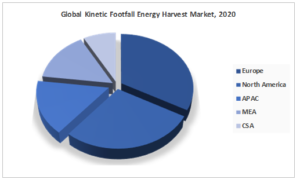
On the basis of region, European region accounted for the largest share in the global kinetic footfall energy harvest market in 2020. The presence of leading company such as Pavegen Inc., coupled with technological advancement in energy harvesting technology puts the region at the forefront for larger adoption of kinetic footfall energy harvesting. The growing emphasis on green cities to reduce the carbon footprint further strengthens the large scale employment of the technology in the EU region. APAC regions offers significant opportunity for this sustainable energy harvesting technology, and is expected to be the key market over the forecast period. The growing economies and emphasis on modern infrastructure and high population density are the primary drivers for Kinetic Footfall Energy Harvest in the region. The increasing awareness among shareholders has further attracted the interest, and investment to develop the technology and overcome the challenges in order to achieve full scale employment.
The report provides detailed market outlook, and forecast of the “Global Kinetic Footfall Energy Harvest” market based on mechanism, component, application, end-use and region.
Report Scope
| Research Attribute | Coverage |
|---|---|
| Years Considered | 2020-2027 |
| Base Year | 2020 |
| Forecast Period | 2021-2030 |
| Units Considered | USD Million/ Square Meter |
| Segmentation By Mechanism |
|
| Segmentation by Component |
|
| Segmentation by Application |
|
| Segmentation By End-Use |
|
| Regions Covered |
|
| Key Company Profiles | Pavegen Inc, Energy Floors, POWERleap Inc., Toyota Boshoku Corp., Hong Kong Applied Science and Technology Research Institute Co Ltd, Innowattech, KinergyPower, SERATECH, KORE Power Inc., EnGo Planet, Kinergizer are among others. |
CHAPTER 1. Market Scope and Methodology
1.1. Research methodology
1.2. Objectives of the report
1.3. Research scope & assumptions
1.4. List of data sources
CHAPTER 2. Executive Summary
2.1. Kinetic Footfall Energy Harvest market – Key industry insights
CHAPTER 3. Market Outlook
3.1. Market definition
3.2. Market segmentation
3.3. Value chain analysis
3.4. Technological overview
3.5. Kinetic Footfall Energy Harvest Market: developed v/s developing countries
3.6. Market opportunities & trends
3.6.1. Electricity-generating flooring seen as a key component of smart city concepts
3.6.2. Countries such as China and India with high footfall offers wide opportunity for the technology
3.6.3. Strategic alliance across the industries to bring the cost down of the technology
3.7. Market dynamics
3.7.1. Market driver analysis
3.7.1.1. Rapid Urbanization across the world
3.7.1.2. Increasing Adoption of Piezoelectric Energy Harvesting Technology
3.7.1.3. Increasing focus on balancing modernization with nature by reducing carbon footprint
3.7.1.4. Impact analysis
3.7.2. Market restraint analysis
3.7.2.1. High cost of the technology
3.7.2.2. Uncertainty about economic life and low degree of awareness in developing regions
3.7.2.3. Impact analysis
3.8. Industry analysis – Porter’s
3.8.1. Bargaining power of suppliers
3.8.2. Bargaining power of buyers
3.8.3. Threat of new entrants
3.8.4. Threat of substitutes
3.8.5. Competitive rivalry
3.9. PESTEL analysis
3.10. SWOT Analysis
3.11. Cost Analysis
CHAPTER 4. Competitive Outlook
4.1. Competitive framework
4.2. Company market share analysis
4.3. Strategic layout
CHAPTER 5. Global Kinetic Footfall Energy Harvest Market Size and Forecast (2020 - 2030)
5.1. Global Kinetic Footfall Energy Harvest Market, By Mechanism (USD Million/Square meter)
5.1.1. Piezoelectric
5.1.2. Magnetic
5.1.3. Generator
5.1.4. Static
5.2. Global Kinetic Footfall Energy Harvest Market, By Component (USD Million)
5.2.1. Sensor
5.2.2. Battery
5.2.3. Transducer
5.2.4. Tiles
5.2.4.1. Rubber
5.2.4.2. Steel
5.2.5. EM Generators
5.2.6. Connecting Rods
5.2.7. Others
5.3. Global Kinetic Footfall Energy Harvest Market, By Application (USD Million)
5.3.1. Lighting
5.3.2. Wayfinding Signage
5.3.3. Wireless communication
5.3.4. Phone Charging
5.3.5. Others
5.4. Global Kinetic Footfall Energy Harvest Market, By End Use (USD Million/Square Meter)
5.4.1. Retail
5.4.2. Dance Clubs
5.4.3. Airports
5.4.4. Railway Stations
5.4.5. School
5.4.6. Corporate
5.4.7. Footpath
5.4.8. Industrial
5.4.9. Others
5.5. Global Kinetic Footfall Energy HarvestMarket, By Region (USD Million/Square Meter)
5.5.1. North America
5.5.2. Europe
5.5.3. Asia-Pacific
5.5.4. Central & South America (CSA)
5.5.5. Middle East & Africa (MEA)
CHAPTER 6. Global Kinetic Footfall Energy Harvest Market Size and Forecast, By Region (2020 - 2030)
6.1. North America Kinetic Footfall Energy Harvest Market (USD Million/Square Meter)
6.1.1. North America Kinetic Footfall Energy Harvest Market, By Country (USD Million/Square Meter)
6.1.2. North America Kinetic Footfall Energy Harvest Market, By Mechanism (USD Million/Square Meter)
6.1.3. North America Kinetic Footfall Energy Harvest Market, By Component (USD Million)
6.1.4. North America Kinetic Footfall Energy Harvest Market, By Application (USD Million)
6.1.5. North America Kinetic Footfall Energy Harvest Market, By End-Use (USD Million/Square Meter)
6.1.6. The U.S. Kinetic Footfall Energy Harvest Market (USD Million/Square Meter)
6.1.6.1. The U.S. Kinetic Footfall Energy Harvest Market, By Mechanism (USD Million/Square Meter)
6.1.6.2. The U.S. Kinetic Footfall Energy Harvest Market, By Component (USD Million)
6.1.6.3. The U.S. Kinetic Footfall Energy Harvest Market, By Application (USD Million)
6.1.6.4. The U.S. Kinetic Footfall Energy Harvest Market, By End-Use (USD Million/Square Meter)
6.1.7. Canada Kinetic Footfall Energy Harvest Market (USD Million/Square Meter)
6.1.7.1. Canada Kinetic Footfall Energy Harvest Market, By Mechanism (USD Million/Square Meter)
6.1.7.2. Canada Kinetic Footfall Energy Harvest Market, By Component (USD Million)
6.1.7.3. Canada Kinetic Footfall Energy Harvest Market, By Application (USD Million)
6.1.7.4. Canada Kinetic Footfall Energy Harvest Market, By End-Use (USD Million/Square Meter)
6.1.8. Mexico Kinetic Footfall Energy Harvest Market (USD Million/Square Meter)
6.1.8.1. Mexico Kinetic Footfall Energy Harvest Market, By Mechanism (USD Million/Square Meter)
6.1.8.2. Mexico Kinetic Footfall Energy Harvest Market, By Component (USD Million)
6.1.8.3. Mexico Kinetic Footfall Energy Harvest Market, By Application (USD Million)
6.1.8.4. Mexico Kinetic Footfall Energy Harvest Market, By End-Use (USD Million/Square Meter)
6.2. Europe Kinetic Footfall Energy Harvest Market (USD Million/Square Meter)
6.2.1. Europe Kinetic Footfall Energy Harvest Market, By Country (USD Million/Square Meter)
6.2.2. Europe Kinetic Footfall Energy Harvest Market, By Mechanism (USD Million/Square Meter)
6.2.3. Europe Kinetic Footfall Energy Harvest Market, By Component (USD Million)
6.2.4. Europe Kinetic Footfall Energy Harvest Market, By Application (USD Million)
6.2.5. Europe Kinetic Footfall Energy Harvest Market, By End-Use (USD Million/Square Meter)
6.2.6. Germany Kinetic Footfall Energy Harvest Market (USD Million/Square Meter)
6.2.6.1. Germany Kinetic Footfall Energy Harvest Market, By Mechanism (USD Million/Square Meter)
6.2.6.2. Germany Kinetic Footfall Energy Harvest Market, By Component (USD Million)
6.2.6.3. Germany Kinetic Footfall Energy Harvest Market, By Application (USD Million)
6.2.6.4. Germany Kinetic Footfall Energy Harvest Market, By End-Use (USD Million/Square Meter)
6.2.7. The U.K Kinetic Footfall Energy HarvestMarket (USD Million/Square Meter)
6.2.7.1. The U.K. Kinetic Footfall Energy Harvest Market, By Mechanism (USD Million/Square Meter)
6.2.7.2. The U.K. Kinetic Footfall Energy Harvest Market, By Component (USD Million)
6.2.7.3. The U.K. Kinetic Footfall Energy Harvest Market, By Application (USD Million)
6.2.7.4. The U.K. Kinetic Footfall Energy Harvest Market, By End-Use (USD Million/Square Meter)
6.2.8. France Kinetic Footfall Energy HarvestMarket (USD Million/Square Meter)
6.2.8.1. France Kinetic Footfall Energy Harvest Market, By Mechanism (USD Million/Square Meter)
6.2.8.2. France Kinetic Footfall Energy Harvest Market, By Component (USD Million)
6.2.8.3. France Kinetic Footfall Energy Harvest Market, By Application (USD Million)
6.2.8.4. France Kinetic Footfall Energy Harvest Market, By End-Use (USD Million/Square Meter)
6.2.9. Netherland Kinetic Footfall Energy HarvestMarket (USD Million/Units)
6.2.9.1. Netherland Kinetic Footfall Energy Harvest Market, By Mechanism (USD Million/Square Meter)
6.2.9.2. Netherland Kinetic Footfall Energy Harvest Market, By Component (USD Million)
6.2.9.3. Netherland Kinetic Footfall Energy Harvest Market, By Application (USD Million)
6.2.9.4. Netherland Kinetic Footfall Energy Harvest Market, By End-Use (USD Million/Square Meter)
6.2.10. Spain Kinetic Footfall Energy HarvestMarket (USD Million/Units)
6.2.10.1. Spain Kinetic Footfall Energy Harvest Market, By Mechanism (USD Million/Square Meter)
6.2.10.2. Spain Kinetic Footfall Energy Harvest Market, By Component (USD Million)
6.2.10.3. Spain Kinetic Footfall Energy Harvest Market, By Application (USD Million)
6.2.10.4. Spain Kinetic Footfall Energy Harvest Market, By End-Use (USD Million/Square Meter)
6.3. Asia-Pacific Kinetic Footfall Energy HarvestMarket (USD Million/Square Meter)
6.3.1. APAC Kinetic Footfall Energy Harvest Market, By Country (USD Million/Square Meter)
6.3.2. APAC Kinetic Footfall Energy Harvest Market, By Mechanism (USD Million/Square Meter)
6.3.3. APAC Kinetic Footfall Energy Harvest Market, By Component (USD Million)
6.3.4. APAC Kinetic Footfall Energy Harvest Market, By Application (USD Million)
6.3.5. APAC Kinetic Footfall Energy Harvest Market, By End-Use (USD Million/Square Meter)
6.3.6. China Kinetic Footfall Energy Harvest Market (USD Million/Square Meter)
6.3.6.1. China Kinetic Footfall Energy Harvest Market, By Mechanism (USD Million/Square Meter)
6.3.6.2. China Kinetic Footfall Energy Harvest Market, By Component (USD Million)
6.3.6.3. China Kinetic Footfall Energy Harvest Market, By Application (USD Million)
6.3.6.4. China Kinetic Footfall Energy Harvest Market, By End-Use (USD Million/Square Meter)
6.3.7. Japan Kinetic Footfall Energy Harvest Market (USD Million/Square Meter)
6.3.7.1. Japan Kinetic Footfall Energy Harvest Market, By Mechanism (USD Million/Square Meter)
6.3.7.2. Japan Kinetic Footfall Energy Harvest Market, By Component (USD Million)
6.3.7.3. Japan Kinetic Footfall Energy Harvest Market, By Application (USD Million)
6.3.7.4. Japan Kinetic Footfall Energy Harvest Market, By End-Use (USD Million/Square Meter)
6.3.8. India Kinetic Footfall Energy Harvest Market (USD Million/Square Meter)
6.3.8.1. India Kinetic Footfall Energy Harvest Market, By Mechanism (USD Million/Square Meter)
6.3.8.2. India Kinetic Footfall Energy Harvest Market, By Component (USD Million)
6.3.8.3. India Kinetic Footfall Energy Harvest Market, By Application (USD Million)
6.3.8.4. India Kinetic Footfall Energy Harvest Market, By End-Use (USD Million/Square Meter)
6.3.9. South Korea Kinetic Footfall Energy Harvest Market (USD Million/Square Meter)
6.3.9.1. South Korea Kinetic Footfall Energy Harvest Market, By Mechanism (USD Million/Square Meter)
6.3.9.2. South Korea Kinetic Footfall Energy Harvest Market, By Component (USD Million)
6.3.9.3. South Korea Kinetic Footfall Energy Harvest Market, By Application (USD Million)
6.3.9.4. South Korea Kinetic Footfall Energy Harvest Market, By End-Use (USD Million/Square Meter)
6.3.10. Malaysia Kinetic Footfall Energy Harvest Market (USD Million/Square Meter)
6.3.10.1. Malaysia Kinetic Footfall Energy Harvest Market, By Mechanism (USD Million/Square Meter)
6.3.10.2. Malaysia Kinetic Footfall Energy Harvest Market, By Component (USD Million)
6.3.10.3. Malaysia Kinetic Footfall Energy Harvest Market, By Application (USD Million)
6.3.10.4. Malaysia Kinetic Footfall Energy Harvest Market, By End-Use (USD Million/Square Meter)
6.3.11. Thailand Kinetic Footfall Energy Harvest Market (USD Million/Square Meter)
6.3.11.1. Thailand Kinetic Footfall Energy Harvest Market, By Mechanism (USD Million/Square Meter)
6.3.11.2. Thailand Kinetic Footfall Energy Harvest Market, By Component (USD Million)
6.3.11.3. Thailand Kinetic Footfall Energy Harvest Market, By Application (USD Million)
6.3.11.4. Thailand Kinetic Footfall Energy Harvest Market, By End-Use (USD Million/Square Meter)
6.3.12. Australia Kinetic Footfall Energy Harvest Market (USD Million/Square Meter)
6.3.12.1. Australia Kinetic Footfall Energy Harvest Market, By Mechanism (USD Million/Square Meter)
6.3.12.2. Australia Kinetic Footfall Energy Harvest Market, By Component (USD Million)
6.3.12.3. Australia Kinetic Footfall Energy Harvest Market, By Application (USD Million)
6.3.12.4. Australia Kinetic Footfall Energy Harvest Market, By End-Use (USD Million/Square Meter)
6.4. Central & South America (CSA) Kinetic Footfall Energy Harvest Market (USD Million/Square Meter)
6.4.1. CSA Kinetic Footfall Energy Harvest Market, By Country (USD Million/Square Meter)
6.4.2. CSA Kinetic Footfall Energy Harvest Market, By Mechanism (USD Million/Square Meter)
6.4.3. CSA Kinetic Footfall Energy Harvest Market, By Component (USD Million)
6.4.4. CSA Kinetic Footfall Energy Harvest Market, By Application (USD Million)
6.4.5. CSA Kinetic Footfall Energy Harvest Market, By End-Use (USD Million/Square Meter)
6.4.6. Brazil Kinetic Footfall Energy Harvest Market (USD Million/Square Meter)
6.4.6.1. Brazil Kinetic Footfall Energy Harvest Market, By Mechanism (USD Million/Square Meter)
6.4.6.2. Brazil Kinetic Footfall Energy Harvest Market, By Component (USD Million)
6.4.6.3. Brazil Kinetic Footfall Energy Harvest Market, By Application (USD Million)
6.4.6.4. Brazil Kinetic Footfall Energy Harvest Market, By End-Use (USD Million/Square Meter)
6.4.7. Argentina Kinetic Footfall Energy Harvest Market (USD Million/Square Meter)
6.4.7.1. Argentina Kinetic Footfall Energy Harvest Market, By Mechanism (USD Million/Square Meter)
6.4.7.2. Argentina Kinetic Footfall Energy Harvest Market, By Component (USD Million)
6.4.7.3. Argentina Kinetic Footfall Energy Harvest Market, By Application (USD Million)
6.4.7.4. Argentina Kinetic Footfall Energy Harvest Market, By End-Use (USD Million/Square Meter)
6.5. Middle East & Africa (MEA) Kinetic Footfall Energy Harvest Market (USD Million/Square Meter)
6.5.1. MEA Kinetic Footfall Energy Harvest Market, By Country (USD Million/Square Meter)
6.5.2. MEA Kinetic Footfall Energy Harvest Market, By Mechanism (USD Million/Square Meter)
6.5.3. MEA Kinetic Footfall Energy Harvest Market, By Component (USD Million)
6.5.4. MEA Kinetic Footfall Energy Harvest Market, By Application (USD Million)
6.5.5. MEA Kinetic Footfall Energy Harvest Market, By End-Use (USD Million/Square Meter)
6.5.6. UAE Kinetic Footfall Energy Harvest Market (USD Million/Square Meter)
6.5.6.1. UAE Kinetic Footfall Energy Harvest Market, By Mechanism (USD Million/Square Meter)
6.5.6.2. UAE Kinetic Footfall Energy Harvest Market, By Component (USD Million)
6.5.6.3. UAE Kinetic Footfall Energy Harvest Market, By Application (USD Million)
6.5.6.4. UAE Kinetic Footfall Energy Harvest Market, By End-Use (USD Million/Square Meter)
6.5.7. South Africa Kinetic Footfall Energy Harvest Market (USD Million/Square Meter)
6.5.7.1. South Africa Kinetic Footfall Energy Harvest Market, By Mechanism (USD Million/Square Meter)
6.5.7.2. South Africa Kinetic Footfall Energy Harvest Market, By Component (USD Million)
6.5.7.3. South Africa Kinetic Footfall Energy Harvest Market, By Application (USD Million)
6.5.7.4. South Africa Kinetic Footfall Energy Harvest Market, By End-Use (USD Million/Square Meter)
CHAPTER 7. Key Players and Strategic Developments
7.1. Pavegen Inc.
7.1.1. Business Overview
7.1.2. Product and Service Offering
7.1.3. Financial Overview
7.1.4. Strategic Developments
7.2. Energy Floors
7.2.1. Business Overview
7.2.2. Product and Service Offering
7.2.3. Financial Overview
7.2.4. Strategic Developments
7.3. POWERleap Inc.,
7.3.1. Business Overview
7.3.2. Product and Service Offering
7.3.3. Financial Overview
7.3.4. Strategic Developments
7.4. Toyota Boshoku Corp.
7.4.1. Business Overview
7.4.2. Product and Service Offering
7.4.3. Financial Overview
7.4.4. Strategic Developments
7.5. Hong Kong Applied Science and Technology Research Institute Co Ltd
7.5.1. Business Overview
7.5.2. Product and Service Offering
7.5.3. Financial Overview
7.5.4. Strategic Developments
7.6. Innowattech
7.6.1. Business Overview
7.6.2. Product and Service Offering
7.6.3. Financial Overview
7.6.4. Strategic Developments
7.7. KinergyPower
7.7.1. Business Overview
7.7.2. Product and Service Offering
7.7.3. Financial Overview
7.7.4. Strategic Developments
7.8. SERATECH
7.8.1. Business Overview
7.8.2. Product and Service Offering
7.8.3. Financial Overview
7.8.4. Strategic Developments
7.9. KORE Power Inc.
7.9.1. Business Overview
7.9.2. Product and Service Offering
7.9.3. Financial Overview
7.9.4. Strategic Developments
7.10. EnGo Planet
7.10.1. Business Overview
7.10.2. Product and Service Offering
7.10.3. Financial Overview
7.10.4. Strategic Developments
7.11. Kinergizer
7.11.1. Business Overview
7.11.2. Product and Service Offering
7.11.3. Financial Overview
7.11.4. Strategic Developments