Australia Silica Sand Market Size, Demand Outlook, COVID-19 Impact, Trend Analysis by Type (Wet Sands, Dry sands, Frac. Sands, Filter Sand, Coated Sand), by Application, by Grade, by length, by End-Use, and Industry Estimates, 2021-2027
- Published: Feb, 2021
- Report ID: QAR-CM02025
- Format: Electronic (PDF)
- Historical Data : 2017 - 2019
- Report Summary
- Table Of Contents
- Request Sample
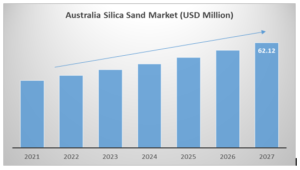
The Australia silica sand market is projected to grow at a CAGR of 7.7% over the next six years. Silica sand is made up of two primary elements: silica and oxygen. It is also known as quartz sand, white sand, or industrial sand. Silicon dioxide is the main constituent of silica sand (SiO2). There are a number of different uses for silica sand in the industrial and commercial sectors, from golf courses to glassmaking. Physical, chemical, and mechanical properties such as grain size, shape, color, composition, and distribution, as well as refractoriness, strength, and stability, all affect how silica sand is used. Australia is a major supplier of silica sand to the customers in the Asia/Pacific region, particularly Japan, South Korea, Taiwan, Malaysia, and the Philippines. Glass- and foundry-grade industrial sand is produced at a number of locations in the country, including the Cape Flattery Mine in North Queensland. Australia is well- positioned to meet the domestic demand and supply the need of application industry using silica sand.
Glassmaking and foundry application segment remains the largest user of Australia’s silica sand industry. Other markets for silica sand include metallurgical applications, chemical manufacturing processes (such as silicon gels), and as an additive in paints and ceramics. It's also used in water purification and filtration, as well as the manufacture of fiberglass.
Australia has a number of shale basins with potential oil reserves, including the Canning and Perth basins in Western Australia. Huge quantities of high tensile strength sands are used in oil and gas drill fracking. These developments are expected to further generate a higher demand for silica sand, and would positively impact the Australian silica sand market.

Segment overview
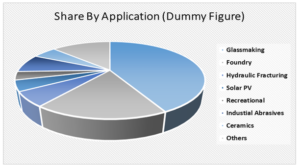
On the basis of application, Glassmaking held the largest share of Australia’s silica sand market. Silica sand is an important component in glassmaking. Container glass occupies the largest share followed by flat glass. Silica is the primary component in most regular glass items, from windows to beer bottles. The color, weight, and clarity of the finished product are all affected by the purity of the silica sand used. The demand for silica sand in Ceramics & Refractories, construction is expected to rise in the region. The application of silica sand in solar PV and high-tech electronic industry is expected to grow at the highest CAGR during the forecast period.

Development:
The Asia Pacific region accounts for almost half of the global demand for silica sand production and consumption, while there still exist some supply gap in the region. Australia, by contrast, is well placed to fill the supply gap.
VRX Silica, an Australian company has three projects in Western Australia: Arrowsmith North, Arrowsmith Central and Muchea, that have a confirmed mine life of 25 years — and the potential to being in production for about 100 years. The projects currently have 1.056 billion tonnes of resources, with grades ranging from 99.6% to 99.9% silicon dioxide (or silica) and low iron impurities. All three projects are located between Geraldton and Perth.
On the basis of region, Queensland and Western Australia regions are the largest producer of silica sand across the country. Increasing exploration and field development activity in the area tend to attract the foreign investment (Mitsubishi, Sibelco and Kemerton sand, Rocla) and local interest in the region. Major players operating in the region are strategizing in order to capitalize on the opportunity, and are paving their way into development of specialty grade of silica for high tech applications.
The report provides detailed market outlook, and forecast of the “Australia silica sand market based on Application, Type, Grade, length, End-Use and by Region. The report provides details of the Australia silica sand market in terms of value (USD million) and volume (Thousand metric ton).
Report Scope
| Research Attribute | Coverage |
|---|---|
| Years Considered | 2017-2027 |
| Historical Years | 2017, 2018, 2019 |
| Base Year | 2020 |
| Forecast Period | 2021-2017 |
| Units Considered | USD Million/Thousand metric ton |
| Segmentation By Application |
|
| Segmentation by Type |
|
| Segmentation By Grade |
|
| Segmentation By End-Use |
|
| Regions Covered |
|
| Key Company Profiles | Mitsubishi Corporation, Diatreme Resources Limited, VRX Silica, Sibelco Australia, KEMERTON SILICA SAND PTY LTD., AUSTRALIAN SILICA QUARTZ GROUP LTD. (ASQ), CAPE FLATTERY SILICA MINES PTY LTD, Metallica Minerals, Perpetual Resources Ltd, TOCHU corporation, Austsand mining pty ltd, Earth Commodities Pty Ltd, Holcim are among others. |
CHAPTER 1. Market Scope and Methodology
1.1. Research methodology
1.2. Objectives of the report
1.3. Research scope & assumptions
1.4. List of data sources
CHAPTER 2. Executive Summary
2.1. Australia Silica Sand market – Key industry insights
CHAPTER 3. Market Outlook
3.1. Market definition
3.2. Market segmentation
3.3. Value chain analysis
3.3.1. Raw material trends
3.3.2. Manufacturing trends
3.4. Technological overview
3.5. Market opportunities & trends
3.5.1. Increasing exploration and development of silica fields
3.5.2. Increasing expenditure for high grade silica sand production
3.6. Market dynamics
3.6.1. Market driver analysis
3.6.1.1. Growing production and foreign investment in the region
3.6.1.2. Increasing usage in high tech applications such as fiber-optics and solar panels
3.6.1.3. Expanding applications across various industries
3.6.1.4. Impact analysis
3.6.2. Market restraint analysis
3.6.2.1. Illegal mining of sand
3.6.2.2. Environmental concern
3.6.2.3. Impact analysis
3.7. Industry analysis – Porter’s
3.7.1. Bargaining power of suppliers
3.7.2. Bargaining power of buyers
3.7.3. Threat of new entrants
3.7.4. Threat of substitutes
3.7.5. Competitive rivalry
3.8. PESTEL analysis
CHAPTER 4. Competitive Outlook
4.1. Competitive framework
4.2. Company market share analysis
4.3. Strategic layout
CHAPTER 5. COVID-19 Implications
5.1. Australia industry impact of COVID-19 pandemic
5.1.1. Impact analysis by application
5.1.2. Analyst recommendations
CHAPTER 6. Australia Silica Sand Market Size and Forecast (2017 - 2027)
6.1. Australia Silica Sand Market, By Type (USD Million/Thousand Metric Ton)
6.1.1. Wet Sands
6.1.2. Dry sands
6.1.3. Frac. Sands
6.1.4. Filter Sand
6.1.5. Coated Sand
6.2. Australia Silica Sand Market, By Application (USD Million/Thousand Metric Ton)
6.2.1. Industrial abrasives
6.2.1.1. Grinding
6.2.1.2. Polishing
6.2.1.3. Sandblasting
6.2.1.4. Honing
6.2.1.5. Sharpening
6.2.1.6. Others
6.2.2. Filtration media
6.2.2.1. Swimming as well as leisure
6.2.2.2. Paper processing
6.2.2.3. Power generation
6.2.2.4. Chemical processing
6.2.2.5. Portable
6.2.2.6. Waste water treatment
6.2.3. Glass Making
6.2.3.1. Container Glass
6.2.3.1.1. Beverage
6.2.3.1.2. Food
6.2.3.1.3. Cosmetics
6.2.3.1.4. Pharmaceuticals
6.2.3.1.5. Technical Product Container
6.2.3.1.6. Others
6.2.3.2. Flat Glass
6.2.3.2.1. Rolled Glass
6.2.3.2.2. Float Glass
6.2.3.3. Specialty Glass
6.2.3.4. Fiber Glass
6.2.4. Paints & coatings
6.2.4.1. Texture coats
6.2.4.2. Wood Finishing
6.2.4.3. Distemper
6.2.4.4. Others
6.2.5. Ceramic
6.2.5.1. Tableware
6.2.5.2. Sanitary Ware
6.2.5.3. floor and wall tile
6.2.5.4. Others
6.2.6. Recreational
6.2.6.1. Golf course
6.2.6.2. Sports Field
6.2.6.3. Beaches
6.2.6.4. Greens and traps
6.2.7. Foundry
6.2.7.1. cast iron
6.2.7.2. steel ferrous
6.2.7.3. non-ferrous foundries.
6.2.8. Hydraulic Fracturing
6.2.8.1. Shale Reservoir
6.2.8.2. Sandstone reservoir
6.2.8.3. Limestone Reservoir
6.2.8.4. Coal Seams
6.2.9. Chemical
6.2.9.1. Construction chemical
6.2.9.2. Adhesive and additives
6.2.9.3. Silicate industries
6.2.9.4. Silicon based chemicals
6.2.9.5. Epoxy flooring
6.2.9.6. Others
6.2.10. Solar Panel Glasses
6.2.11. Electronics
6.2.12. Others
6.3. Australia Silica Sand Market, By Grade (USD Million/Thousand Metric Ton)
6.3.1. Glass Grade
6.3.2. Foundry Grade
6.3.3. Specialty Grade
6.3.4. Others
6.4. Australia Silica Sand Market, By End-Use (USD Million/Thousand Metric Ton)
6.4.1. Industrial
6.4.2. Commercial
6.5. Australia Silica Sand Market, By Region (USD Million/Thousand Metric Ton)
6.5.1. New South Wales
6.5.2. Queensland
6.5.3. South Australia
6.5.4. Tasmania
6.5.5. Victoria
6.5.6. Western Australia
CHAPTER 7. Australia Silica Sand Market Size and Forecast, By Region (2017 - 2027)
7.1. Australia Silica Sand Market (USD Million/Thousand Metric Ton)
7.1.1. Australia Silica Sand Market, By Region (USD Million/ Thousand Metric Ton)
7.1.2. Australia Silica Sand Market, By Application (USD Million/ Thousand Metric Ton)
7.1.3. Australia Silica Sand Market, By Type (USD Million/ Thousand Metric Ton)
7.1.4. Australia Silica Sand Market, By Grade (USD Million/ Thousand Metric Ton)
7.1.5. Australia Silica Sand Market, By End-Use (USD Million/ Thousand Metric Ton)
7.1.6. New South Wales Silica Sand Market (USD Million/ Thousand Metric Ton)
7.1.6.1. New South Wales Silica Sand Market, By Application (USD Million/ Thousand Metric Ton)
7.1.6.2. New South Wales Silica Sand Market, By Type (USD Million/ Thousand Metric Ton)
7.1.6.3. New South Wales Silica Sand Market, By Grade (USD Million/ Thousand Metric Ton)
7.1.6.4. New South Wales Silica Sand Market, By End-Use (USD Million/ Thousand Metric Ton)
7.1.7. Queensland Silica Sand Market (USD Million/ Thousand Metric Ton)
7.1.7.1. Queensland Silica Sand Market, By Application (USD Million/ Thousand Metric Ton)
7.1.7.2. Queensland Silica Sand Market, By Type (USD Million/ Thousand Metric Ton)
7.1.7.3. Queensland Silica Sand Market, By Grade (USD Million/ Thousand Metric Ton)
7.1.7.4. Queensland Silica Sand Market, By End-Use (USD Million/ Thousand Metric Ton)
7.1.8. South Australia Silica Sand Market (USD Million/ Thousand Metric Ton)
7.1.8.1. South Australia Silica Sand Market, By Application (USD Million/ Thousand Metric Ton)
7.1.8.2. South Australia Silica Sand Market, By Type (USD Million/ Thousand Metric Ton)
7.1.8.3. South Australia Silica Sand Market, By Grade (USD Million/ Thousand Metric Ton)
7.1.8.4. South Australia Silica Sand Market, By End-Use (USD Million/ Thousand Metric Ton)
7.1.9. Tasmania Silica Sand Market (USD Million/ Thousand Metric Ton)
7.1.9.1. Tasmania Silica Sand Market, By Application (USD Million/ Thousand Metric Ton)
7.1.9.2. Tasmania Silica Sand Market, By Type (USD Million/ Thousand Metric Ton)
7.1.9.3. Tasmania Silica Sand Market, By Grade (USD Million/ Thousand Metric Ton)
7.1.9.4. Tasmania Silica Sand Market, By End-Use (USD Million/ Thousand Metric Ton)
7.1.10. Victoria Silica Sand Market (USD Million/ Thousand Metric Ton)
7.1.10.1. Victoria Silica Sand Market, By Application (USD Million/ Thousand Metric Ton)
7.1.10.2. Victoria Silica Sand Market, By Type (USD Million/ Thousand Metric Ton)
7.1.10.3. Victoria Silica Sand Market, By Grade (USD Million/ Thousand Metric Ton)
7.1.10.4. Victoria Silica Sand Market, By End-Use (USD Million/ Thousand Metric Ton)
7.1.11. Western Australia Silica Sand Market (USD Million/ Thousand Metric Ton)
7.1.11.1. Western Australia Silica Sand Market, By Application (USD Million/ Thousand Metric Ton)
7.1.11.2. Western Australia Silica Sand Market, By Type (USD Million/ Thousand Metric Ton)
7.1.11.3. Western Australia Silica Sand Market, By Grade (USD Million/ Thousand Metric Ton)
7.1.11.4. Western Australia Silica Sand Market, By End-Use (USD Million/ Thousand Metric Ton)
CHAPTER 8. Key Players and Strategic Developments
8.1. Mitsubishi Corporation
8.1.1. Business Overview
8.1.2. Product and Service Offering
8.1.3. Financial Overview
8.1.4. Strategic Developments
8.2. Diatreme Resources Limited
8.2.1. Business Overview
8.2.2. Product and Service Offering
8.2.3. Financial Overview
8.2.4. Strategic Developments
8.3. VRX Silica
8.3.1. Business Overview
8.3.2. Product and Service Offering
8.3.3. Financial Overview
8.3.4. Strategic Developments
8.4. Sibelco Australia
8.4.1. Business Overview
8.4.2. Product and Service Offering
8.4.3. Financial Overview
8.4.4. Strategic Developments
8.5. KEMERTON SILICA SAND PTY LTD.
8.5.1. Business Overview
8.5.2. Product and Service Offering
8.5.3. Financial Overview
8.5.4. Strategic Developments
8.6. AUSTRALIAN SILICA QUARTZ GROUP LTD.
8.6.1. Business Overview
8.6.2. Product and Service Offering
8.6.3. Financial Overview
8.6.4. Strategic Developments
8.7. CAPE FLATTERY SILICA MINES PTY LTD.
8.7.1. Business Overview
8.7.2. Product and Service Offering
8.7.3. Financial Overview
8.7.4. Strategic Developments
8.8. Metallica Minerals
8.8.1. Business Overview
8.8.2. Product and Service Offering
8.8.3. Financial Overview
8.8.4. Strategic Developments
8.9. Perpetual Resources Ltd.
8.9.1. Business Overview
8.9.2. Product and Service Offering
8.9.3. Financial Overview
8.9.4. Strategic Developments
8.10. Qingdao TOCHU corporation
8.10.1. Business Overview
8.10.2. Product and Service Offering
8.10.3. Financial Overview
8.10.4. Strategic Developments
8.11. Austsand Mining Pty Ltd.
8.11.1. Business Overview
8.11.2. Product and Service Offering
8.11.3. Financial Overview
8.11.4. Strategic Developments
8.12. Earth Commodities Pty Ltd.
8.12.1. Business Overview
8.12.2. Product and Service Offering
8.12.3. Financial Overview
8.12.4. Strategic Developments
8.13. Holcim
8.13.1. Business Overview
8.13.2. Product and Service Offering
8.13.3. Financial Overview
8.13.4. Strategic Developments
