
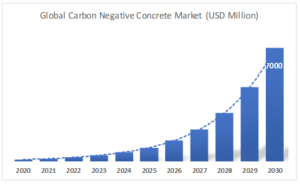
The Global carbon negative concrete market is projected to grow at a CAGR of 52.9% over the next ten years. The key drivers of the carbon negative concrete are; stringent greenhouse gas (GHG) emissions targets across the globe, growing Initiatives to reduce emissions across the industry supply chain, and large scale Investment by industry stakeholders in R&D and technological advancements.
Cement manufacture is one of the major contributors of carbon dioxide in the atmosphere, accounting for up to 8% of worldwide emissions, according to the study by the Netherlands Environmental Assessment Agency. To bring the cement sector in line with the Paris Agreement on climate change, its annual emissions will need to fall by at least 16 per cent by 2030. However, with growing urbanization, the demand for housing and other infrastructure projects would rise over the coming years and material as versatile as concrete is yet to be discovered. The key stakeholders are continuously looking for more environmentally friendly solutions which can help build for the future with sustainability. More and more efforts are being put by governments, market players, and manufacturers for the green construction initiative.
One of the major challenge faced by that the industry is that there is a very little short-term economic motivation to make changes in the absence of a robust carbon-pricing signal. Alternative materials are frequently unavailable at the required scale. Architects, engineers, contractors, and clients, on the other hand, are understandably wary of new building materials. More information about the possibilities for scalable, sustainable alternatives to traditional carbon-intensive cement and concrete is needed for decision-makers.
Segment overview
On the basis of Product, carbon negative concrete blocks held the largest share of global carbon negative concrete market in 2020. Easy workability and environmental friendly nature of these blocks strengthen their demand across the globe. These blocks offer up to a 50% reduction in cement, and a 60-65% reduction in embodied energy compared to conventional concrete masonry. These concrete blocks have a lot of potential in terms of meeting the needs of the social, commercial, and industrial sectors for a fast, scalable, low emission and cost-effective construction.
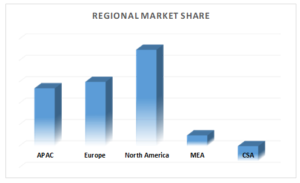
On the basis of region, North American region accounted for the largest share in the global carbon negative concrete market in 2020. The increasing demand for these concrete in the region is due to strong legislation and supportive policies that promote green construction initiatives. Presence of key players and innovative technology has further strengthened the demand for low carbon concrete in the North America region. Asia-Pacific (APAC) region offers significant opportunity for the carbon negative concrete products, and is expected to be the key market over the forecast period with China leading the way. The growing economies and emphasis on modern and sustainable infrastructure are the key primary drivers for carbon negative concrete in the region. The implementation of strict policies and pressure from world community to reduce the green house emission is expected to increase carbon negative concrete demand across construction industry of the region.
The report provides detailed market outlook, and forecast of the “Global Carbon Negative Concrete” market based on product, structure, application, end-use and region.
Developments:
- With financing from the Quebec government, Carbicrete of Montreal has devised a way of creating concrete without cement by replacing it with steel slag, a byproduct of steel manufacture. Not only does the approach eliminate traditional cement-related carbon emissions, but the chemical reaction used to make the new concrete also consumes carbon dioxide, lowering the net carbon footprint even further.
- The concrete maker Cemex is addressing the trend of manufacturing concrete with a smaller carbon footprint and the company first net-zero CO2 concrete to be available worldwide
- Low-CO2 concrete is a growing market. In September 2020, Amazon invested in CarbonCure Technologies as part of the online retail giant’s goal to be carbon-neutral by 2050. CarbonCure injects captured CO2 into wet concrete, which the firm says strengthens the final material. Solidia, which earlier this year expanded a partnership with the concrete maker LafargeHolcim, takes a similar approach, using captured CO2 to cure prefabricated concrete blocks and other components.
Report Scope
| Research Attribute | Coverage |
|---|---|
| Years Considered | 2020-2030 |
| Base Year | 2020 |
| Forecast Period | 2021-2030 |
| Units Considered | USD Million/ Cubic meter |
| Segmentation By Product |
|
| Segmentation by Structure |
|
| Segmentation by Application |
|
| Segmentation By End-Use |
|
| Regions Covered |
|
| Key Company Profiles | CarbiCrete, Cemex, Heidelberg Cement, Bay aggregate LLC, Kajima Corporation, Denka Company, LafargeHolcim, Solidia Technology, Carboclave Technology, Cemex are among others. |
CHAPTER 1. Market Scope and Methodology
1.1. Research methodology
1.2. Objectives of the report
1.3. Research scope & assumptions
1.4. List of data sources
CHAPTER 2. Executive Summary
2.1. Carbon negative concrete market – Key industry insights
CHAPTER 3. Market Outlook
3.1. Market definition
3.2. Market segmentation
3.3. Value chain analysis
3.3.1. Raw material trends
3.3.2. Manufacturing trends
3.4. Technological overview
3.5. Carbon negative concrete Market: developed v/s developing countries
3.6. Market opportunities & trends
3.6.1. Determining the most efficient path and technology to achieve decarbonization
3.7. Market dynamics
3.7.1. Market driver analysis
3.7.1.1. Stringent greenhouse gas (GHG) emission targets across the globe
3.7.1.2. Initiatives to reduce carbon emissions across the cement industry supply chain
3.7.1.3. Increasing large scale Investments by industry stakeholders in R&D
3.7.1.4. Impact analysis
3.7.2. Market restraint analysis
3.7.2.1. Availability of raw material
3.7.2.2. Economic feasibility
3.7.2.3. Impact analysis
3.8. Industry analysis – Porter’s
3.8.1. Bargaining power of suppliers
3.8.2. Bargaining power of buyers
3.8.3. Threat of new entrants
3.8.4. Threat of substitutes
3.8.5. Competitive rivalry
3.9. PESTEL analysis
3.10. SWOT Analysis
CHAPTER 4. Competitive Outlook
4.1. Competitive framework
4.2. Company market share analysis
4.3. Strategic layout
CHAPTER 5. COVID-19 Implications
5.1. Global industry impact of COVID-19 pandemic
5.1.1. Impact analysis
5.1.2. Analyst recommendations
CHAPTER 6. Global Carbon negative concrete Market Size and Forecast (2020 - 2030)
6.1. Global Carbon negative concrete Market, By Product (USD Million/Cubic Meter)
6.1.1. Blocks
6.1.2. Bricks
6.1.3. Panels
6.1.4. Tiles
6.1.5. Slab
6.1.6. Others
6.2. Global Carbon negative concrete Market, By Structure (USD Million/Cubic Meter)
6.2.1. Solid
6.2.2. Hollow
6.2.3. Cellular
6.2.4. Others
6.3. Global Carbon negative concrete Market, By Application (USD Million/Cubic Meter)
6.3.1. Masonry
6.3.2. Road Construction
6.3.3. Pipe bedding
6.3.4. Bridge Sub-structure
6.3.5. Airport
6.3.6. Void Filling
6.3.7. Others
6.4. Global Carbon negative concrete Market, By End-Use (USD Million/Cubic Meter)
6.4.1. Public Infrastructure
6.4.2. Residential Building
6.4.3. Commercial Building
6.4.4. Others
6.5. Global Carbon negative concrete Market, By Region (USD Million/Cubic Meter)
6.5.1. North America
6.5.2. Europe
6.5.3. Asia-Pacific
6.5.4. Central & South America (CSA)
6.5.5. Middle East & Africa (MEA)
CHAPTER 7. Global Carbon negative concrete Market Size and Forecast, By Region (2020 - 2030)
7.1. North America Carbon negative concrete Market (USD Million/Cubic Meter)
7.1.1. North America Carbon negative concrete Market, By Country (USD Million/ Cubic Meter)
7.1.2. North America Carbon negative concrete Market, By Product (USD Million/ Cubic Meter)
7.1.3. North America Carbon negative concrete Market, By Structure (USD Million/ Cubic Meter)
7.1.4. North America Carbon negative concrete Market, By Application (USD Million/ Cubic Meter)
7.1.5. North America Carbon negative concrete Market, By End-Use (USD Million/ Cubic Meter)
7.1.6. The U.S. Carbon negative concrete Market (USD Million/ Cubic Meter)
7.1.6.1. The U.S. Carbon negative concrete Market, By Product (USD Million/ Cubic Meter)
7.1.6.2. The U.S. Carbon negative concrete Market, By Structure (USD Million/ Cubic Meter)
7.1.6.3. The U.S. Carbon negative concrete Market, By Application (USD Million/ Cubic Meter)
7.1.6.4. The U.S. Carbon negative concrete Market, By End-Use (USD Million/ Cubic Meter)
7.1.7. Canada Carbon negative concrete Market (USD Million/Cubic Meter)
7.1.7.1. Canada Carbon negative concrete Market, By Product (USD Million/ Cubic Meter)
7.1.7.2. Canada Carbon negative concrete Market, By Structure (USD Million/ Cubic Meter)
7.1.7.3. Canada Carbon negative concrete Market, By Application (USD Million/ Cubic Meter)
7.1.7.4. Canada Carbon negative concrete Market, By End-Use (USD Million/ Cubic Meter)
7.1.8. Mexico Carbon negative concrete Market (USD Million/Cubic Meter)
7.1.8.1. Mexico Carbon negative concrete Market, By Product (USD Million/ Cubic Meter)
7.1.8.2. Mexico Carbon negative concrete Market, By Structure (USD Million/ Cubic Meter)
7.1.8.3. Mexico Carbon negative concrete Market, By Application (USD Million/ Cubic Meter)
7.1.8.4. Mexico Carbon negative concrete Market, By End-Use (USD Million/ Cubic Meter)
7.2. Europe Carbon negative concrete Market (USD Million/Cubic Meter)
7.2.1. Europe Carbon negative concrete Market, By Country (USD Million/ Cubic Meter)
7.2.2. Europe Carbon negative concrete Market, By Product (USD Million/ Cubic Meter)
7.2.3. Europe Carbon negative concrete Market, By Structure (USD Million/ Cubic Meter)
7.2.4. Europe Carbon negative concrete Market, By Application (USD Million/ Cubic Meter)
7.2.5. Europe Carbon negative concrete Market, By End-Use (USD Million/ Cubic Meter)
7.2.6. Germany Carbon negative concrete Market (USD Million/Cubic Meter)
7.2.6.1. Germany Carbon negative concrete Market, By Product (USD Million/ Cubic Meter)
7.2.6.2. Germany Carbon negative concrete Market, By Structure (USD Million/ Cubic Meter)
7.2.6.3. Germany Carbon negative concrete Market, By Application (USD Million/ Cubic Meter)
7.2.6.4. Germany Carbon negative concrete Market, By End-Use (USD Million/ Cubic Meter)
7.2.7. The U.K Carbon negative concrete Market (USD Million/Cubic Meter)
7.2.7.1. The U.K. Carbon negative concrete Market, By Product (USD Million/ Cubic Meter)
7.2.7.2. The U.K. Carbon negative concrete Market, By Structure (USD Million/ Cubic Meter)
7.2.7.3. The U.K. Carbon negative concrete Market, By Application (USD Million/ Cubic Meter)
7.2.7.4. The U.K. Carbon negative concrete Market, By End-Use (USD Million/ Cubic Meter)
7.2.8. France Carbon negative concrete Market (USD Million/Cubic Meter)
7.2.8.1. France Carbon negative concrete Market, By Product (USD Million/ Cubic Meter)
7.2.8.2. France Carbon negative concrete Market, By Structure (USD Million/ Cubic Meter)
7.2.8.3. France Carbon negative concrete Market, By Application (USD Million/ Cubic Meter)
7.2.8.4. France Carbon negative concrete Market, By End-Use (USD Million/ Cubic Meter)
7.2.9. Sweden Carbon negative concrete Market (USD Million/Cubic Meter)
7.2.9.1. Sweden Carbon negative concrete Market, By Product (USD Million/ Cubic Meter)
7.2.9.2. Sweden Carbon negative concrete Market, By Structure (USD Million/ Cubic Meter)
7.2.9.3. Sweden Carbon negative concrete Market, By Application (USD Million/ Cubic Meter)
7.2.9.4. Sweden Carbon negative concrete Market, By End-Use (USD Million/ Cubic Meter)
7.2.10. Spain Carbon negative concrete Market (USD Million/Cubic Meter)
7.2.10.1. Spain Carbon negative concrete Market, By Product (USD Million/ Cubic Meter)
7.2.10.2. Spain Carbon negative concrete Market, By Structure (USD Million/ Cubic Meter)
7.2.10.3. Spain Carbon negative concrete Market, By Application (USD Million/ Cubic Meter)
7.2.10.4. Spain Carbon negative concrete Market, By End-Use (USD Million/ Cubic Meter)
7.3. Asia-Pacific Carbon negative concrete Market (USD Million/Cubic Meter)
7.3.1. APAC Carbon negative concrete Market, By Country (USD Million/ Cubic Meter)
7.3.2. APAC Carbon negative concrete Market, By Product (USD Million/ Cubic Meter)
7.3.3. APAC Carbon negative concrete Market, By Structure (USD Million/ Cubic Meter)
7.3.4. APAC Carbon negative concrete Market, By Application (USD Million/ Cubic Meter)
7.3.5. APAC Carbon negative concrete Market, By End-Use (USD Million/ Cubic Meter)
7.3.6. China Carbon negative concrete Market (USD Million/Cubic Meter)
7.3.6.1. China Carbon negative concrete Market, By Product (USD Million/ Cubic Meter)
7.3.6.2. China Carbon negative concrete Market, By Structure (USD Million/ Cubic Meter)
7.3.6.3. China Carbon negative concrete Market, By Application (USD Million/ Cubic Meter)
7.3.6.4. China Carbon negative concrete Market, By End-Use (USD Million/ Cubic Meter)
7.3.7. Japan Carbon negative concrete Market (USD Million/Cubic Meter)
7.3.7.1. Japan Carbon negative concrete Market, By Product (USD Million/ Cubic Meter)
7.3.7.2. Japan Carbon negative concrete Market, By Structure (USD Million/ Cubic Meter)
7.3.7.3. Japan Carbon negative concrete Market, By Application (USD Million/ Cubic Meter)
7.3.7.4. Japan Carbon negative concrete Market, By End-Use (USD Million/ Cubic Meter)
7.3.8. India Carbon negative concrete Market (USD Million/Cubic Meter)
7.3.8.1. India Carbon negative concrete Market, By Product (USD Million/ Cubic Meter)
7.3.8.2. India Carbon negative concrete Market, By Structure (USD Million/ Cubic Meter)
7.3.8.3. India Carbon negative concrete Market, By Application (USD Million/ Cubic Meter)
7.3.8.4. India Carbon negative concrete Market, By End-Use (USD Million/ Cubic Meter)
7.3.9. South Korea Carbon negative concrete Market (USD Million/Cubic Meter)
7.3.9.1. South Korea Carbon negative concrete Market, By Product (USD Million/ Cubic Meter)
7.3.9.2. South Korea Carbon negative concrete Market, By Structure (USD Million/ Cubic Meter)
7.3.9.3. South Korea Carbon negative concrete Market, By Application (USD Million/ Cubic Meter)
7.3.9.4. South Korea Carbon negative concrete Market, By End-Use (USD Million/ Cubic Meter)
7.3.10. Indonesia Carbon negative concrete Market (USD Million/Cubic Meter)
7.3.10.1. Indonesia Carbon negative concrete Market, By Product (USD Million/ Cubic Meter)
7.3.10.2. Indonesia Carbon negative concrete Market, By Structure (USD Million/ Cubic Meter)
7.3.10.3. Indonesia Carbon negative concrete Market, By Application (USD Million/ Cubic Meter)
7.3.10.4. Indonesia Carbon negative concrete Market, By End-Use (USD Million/ Cubic Meter)
7.3.11. Thailand Carbon negative concrete Market (USD Million/Cubic Meter)
7.3.11.1. Thailand Carbon negative concrete Market, By Product (USD Million/ Cubic Meter)
7.3.11.2. Thailand Carbon negative concrete Market, By Structure (USD Million/ Cubic Meter)
7.3.11.3. Thailand Carbon negative concrete Market, By Application (USD Million/ Cubic Meter)
7.3.11.4. Thailand Carbon negative concrete Market, By End-Use (USD Million/ Cubic Meter)
7.3.12. Australia Carbon negative concrete Market (USD Million/Cubic Meter)
7.3.12.1. Australia Carbon negative concrete Market, By Product (USD Million/ Cubic Meter)
7.3.12.2. Australia Carbon negative concrete Market, By Structure (USD Million/ Cubic Meter)
7.3.12.3. Australia Carbon negative concrete Market, By Application (USD Million/ Cubic Meter)
7.3.12.4. Australia Carbon negative concrete Market, By End-Use (USD Million/ Cubic Meter)
7.4. Central & South America (CSA) Carbon negative concrete Market (USD Million/Cubic Meter)
7.4.1. CSA Carbon negative concrete Market, By Country (USD Million/ Cubic Meter)
7.4.2. CSA Carbon negative concrete Market, By Product (USD Million/ Cubic Meter)
7.4.3. CSA Carbon negative concrete Market, By Structure (USD Million/ Cubic Meter)
7.4.4. CSA Carbon negative concrete Market, By Application (USD Million/ Cubic Meter)
7.4.5. CSA Carbon negative concrete Market, By End-Use (USD Million/ Cubic Meter)
7.4.6. Brazil Carbon negative concrete Market (USD Million/Cubic Meter)
7.4.6.1. Brazil Carbon negative concrete Market, By Product (USD Million/ Cubic Meter)
7.4.6.2. Brazil Carbon negative concrete Market, By Structure (USD Million/ Cubic Meter)
7.4.6.3. Brazil Carbon negative concrete Market, By Application (USD Million/ Cubic Meter)
7.4.6.4. Brazil Carbon negative concrete Market, By End-Use (USD Million/ Cubic Meter)
7.4.7. Argentina Carbon negative concrete Market (USD Million/Cubic Meter)
7.4.7.1. Argentina Carbon negative concrete Market, By Product (USD Million/ Cubic Meter)
7.4.7.2. Argentina Carbon negative concrete Market, By Structure (USD Million/ Cubic Meter)
7.4.7.3. Argentina Carbon negative concrete Market, By Application (USD Million/ Cubic Meter)
7.4.7.4. Argentina Carbon negative concrete Market, By End-Use (USD Million/ Cubic Meter)
7.5. Middle East & Africa (MEA) Carbon negative concrete Market (USD Million/Cubic Meter)
7.5.1. MEA Carbon negative concrete Market, By Country (USD Million/ Cubic Meter)
7.5.2. MEA Carbon negative concrete Market, By Product (USD Million/ Cubic Meter)
7.5.3. MEA Carbon negative concrete Market, By Structure (USD Million/ Cubic Meter)
7.5.4. MEA Carbon negative concrete Market, By Application (USD Million/ Cubic Meter)
7.5.5. MEA Carbon negative concrete Market, By End-Use (USD Million/ Cubic Meter)
7.5.6. UAE Carbon negative concrete Market (USD Million/Cubic Meter)
7.5.6.1. UAE Carbon negative concrete Market, By Product (USD Million/ Cubic Meter)
7.5.6.2. UAE Carbon negative concrete Market, By Structure (USD Million/ Cubic Meter)
7.5.6.3. UAE Carbon negative concrete Market, By Application (USD Million/ Cubic Meter)
7.5.6.4. UAE Carbon negative concrete Market, By End-Use (USD Million/ Cubic Meter)
7.5.7. Saudi Arabia Carbon negative concrete Market (USD Million/Cubic Meter)
7.5.7.1. Saudi Arabia Carbon negative concrete Market, By Product (USD Million/ Cubic Meter)
7.5.7.2. Saudi Arabia Carbon negative concrete Market, By Structure (USD Million/ Cubic Meter)
7.5.7.3. Saudi Arabia Carbon negative concrete Market, By Application (USD Million/ Cubic Meter)
7.5.7.4. Saudi Arabia Carbon negative concrete Market, By End-Use (USD Million/ Cubic Meter)
7.5.8. South Africa Carbon negative concrete Market (USD Million/Cubic Meter)
7.5.8.1. South Africa Carbon negative concrete Market, By Product (USD Million/ Cubic Meter)
7.5.8.2. South Africa Carbon negative concrete Market, By Structure (USD Million/ Cubic Meter)
7.5.8.3. South Africa Carbon negative concrete Market, By Application (USD Million/ Cubic Meter)
7.5.8.4. South Africa Carbon negative concrete Market, By End-Use (USD Million/ Cubic Meter)
CHAPTER 8. Key Players and Strategic Developments
8.1. CarbiCrete
8.1.1. Business Overview
8.1.2. Product and Service Offering
8.1.3. Financial Overview
8.2. Cemex
8.2.1. Business Overview
8.2.2. Product and Service Offering
8.2.3. Financial Overview
8.2.4. Strategic Developments
8.3. Heidelberg Cement
8.3.1. Business Overview
8.3.2. Product and Service Offering
8.3.3. Financial Overview
8.3.4. Strategic Developments
8.4. Bay aggregate LLC
8.4.1. Business Overview
8.4.2. Product and Service Offering
8.4.3. Financial Overview
8.4.4. Strategic Developments
8.5. Kajima Corporation
8.5.1. Business Overview
8.5.2. Product and Service Offering
8.5.3. Financial Overview
8.5.4. Strategic Developments
8.6. Denka Company
8.6.1. Business Overview
8.6.2. Product and Service Offering
8.6.3. Financial Overview
8.6.4. Strategic Developments
8.7. LafargeHolcim
8.7.1. Business Overview
8.7.2. Product and Service Offering
8.7.3. Financial Overview
8.7.4. Strategic Developments
8.8. Solidia Technology
8.8.1. Business Overview
8.8.2. Product and Service Offering
8.8.3. Financial Overview
8.8.4. Strategic Developments
8.9. Carboclave Technology
8.9.1. Business Overview
8.9.2. Product and Service Offering
8.9.3. Financial Overview
8.9.4. Strategic Developments
8.10. CNBM BOUYGUES Construction
8.10.1. Business Overview
8.10.2. Product and Service Offering
8.10.3. Financial Overview
8.10.4. Strategic Developments